Exploring Big O Notation in Polyglot Notebooks
Using the time magic command to explore algorithmic performance

Polyglot Notebooks is a great way of running interactive code experiments mixed together with rich markdown documentation.
In this short article I want to introduce you to the #!time magic command and show you how you can easily measure the execution time of a block of code.
This can be helpful for understanding the rough performance characteristics of a block of code inside of your Polyglot Notebook.
In fact, we’ll use this to explore the programming concepts behind Big O notation and how code performance changes based on the number of items.
This article builds upon basic knowledge of Polyglot Notebooks so if you are not yet familiar with that, I highly recommend you read my Introducing Polyglot Notebooks article first.
Recording Execution Time
Let’s start off here showing how the #!time magic command can be used to measure the execution time of a cell.
Before we do that, let’s define a number of items variable in a C# code cell:
// The number of items for our loop
int numItems = 100;
We can then reference this variable in another cell:
// This is constant Time O(1)
Console.WriteLine(numItems);
When we run this cell, we’ll see 100 printed out below the cell.
However, if you wanted to instead see the amount of time the cell took to execute, you could add the #!time magic command to the beginning of the code block as shown below:
#!time

// This is constant Time O(1)
Console.WriteLine(numItems);
Now when you run this cell you’ll see a time it took the .NET Interactive kernel to run that cell. If you run the cell multiple times you’ll likely see some variance in responses. These are a few values I saw:
- Wall time: 13.2689ms
- Wall time: 9.1655ms
- Wall time: 9.793ms
There are a few things I note about this.
First, the first run tends to be slower than subsequent runs. That’s often a normal thing you see in dotnet in general with just-in-time compilation (JIT). I’m not sure if that’s a factor under the hood for Polyglot Notebooks / .NET Interactive, but I wouldn’t be surprised if it was.
Secondly, the wall time metrics reported below the cell are typically different and more precise than the cell’s recorded time running itself.

This is where the real value of the #!time magic command comes into play: it records just the time of your .NET code and returns the time with a greater degree of precision than the cell’s user interface displays.
Finally, note that any cell output is still rendered below the cell. The wall time indicator is just an additional piece of information available to you.
Exploring Big O Performance with the Time Magic Command
Now that we have the basics of the #!time magic command down, we can use it to explore the performance characteristics of different types of algorithms in code.
This article isn’t intended to be a broad introduction to Big O notation, and a proper exploration of Big O requires a class or two from a computer science curriculum, but here’s Big O notation in a nutshell:
Big O notation is a way of understanding the way that the duration of an algorithm scales as the number of items the algorithm is acting upon increases.
Big O(1) - Constant Time
The code we did earlier where we did a Console.WriteLine(numItems); is Big O(1) or constant time. It doesn’t matter how large numItems is, it should take roughly the same amount of time to write its value whether numItems is 1 or 2.1 billion.
Here’s the full table of results I observed for various item levels:
| Number of Items | Time in Milliseconds |
|---|---|
| 1 | 15.5097 |
| 10 | 11.5248 |
| 100 | 10.6307 |
| 1000 | 11.7832 |
| 10000 | 12.1653 |
| 100000 | 11.5297 |
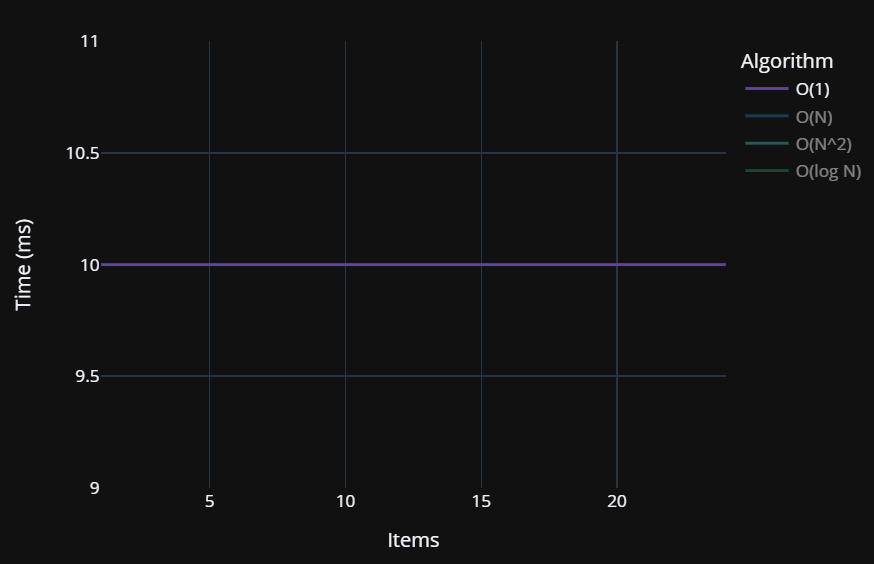
As you can see, there’s some natural fluctuations, but the performance level stays more or less the same as the number of items increases. This variation is natural in programming due to small shifts in CPU utilization and RAM between runs.
We can represent this on a chart as a more or less constant performance level that doesn’t shift as the item count grows:
Big O(N) - Linear Time
Let’s take a look at Big O(N) or linear time. This type of algorithm will have its time grow in a predictable and linear manner as numItems increases.
A simple example of Big O(N) or linear time is a simple for loop as shown below:
#!time

long sum = 0;

// Calculate the sum of all numbers from 0 to 1 less than numItems
for (int i = 0; i < numItems; i++)
{
    sum += i;
}
Here our time measurements should follow a roughly linear line that increases as the number of items increases:
| Number of Items | Time in Milliseconds |
|---|---|
| 1 | 8.5396 |
| 10 | 9.6775 |
| 100 | 8.1355 |
| 1000 | 14.1006 |
| 10000 | 16.9402 |
| 100000 | 19.4948 |
While this data has a certain degree of noise to it, once we pass the natural variation levels a linear trend emerges where the more items we see, the time taken grows in a fairly linear and predictable manner as shown below:
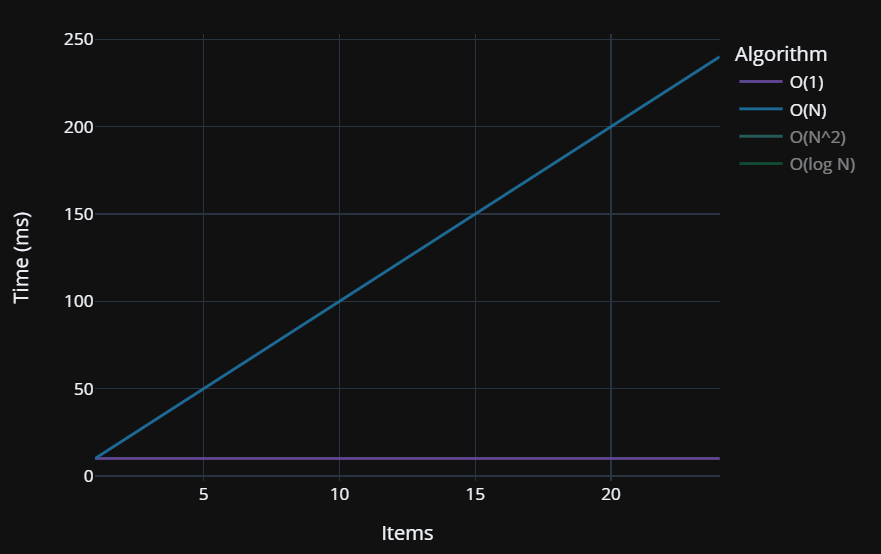
Note: the charts in this article do not strictly match the data but represent typical Big O notation curves
Big O(N Squared) - Quadratic Time
Sometimes you need to have loops nested inside of other loops. This causes your performance to increase at a quadratic rate.
We refer to this performance characteristic as Big O(N^2) or quadratic time.
We generally try to avoid quadratic time if we can, but it’s not always possible. For example, sometimes you really need to look at combinations of every item with every other item.
Here’s some N Squared code:
#!time

long sum = 0;

for (int i = 0; i < numItems; i++)
{
    for (int j = 0; j < numItems; j++)
    {
        sum += i;
    }
}
Note that for every item we are looping over all items again inside of its for loop. This results in the following performance characteristics:
| Number of Items | Time in Milliseconds |
|---|---|
| 1 | 7.3658 |
| 10 | 7.7903 |
| 100 | 15.7163 |
| 1000 | 15.6515 |
| 10000 | 324.2602 |
| 100000 | 26716.3727 |
When plotted on a graph, this quadratic level of growth quickly becomes clear:
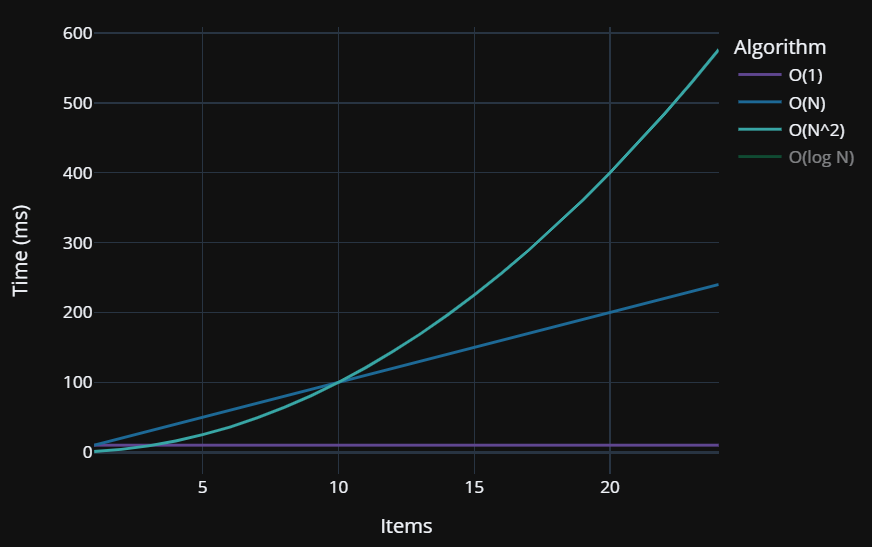
As you can see, quadratic time should be avoided when possible, because even though it may perform faster than other routines at low item counts, large item counts will quickly impact its performance.
Big O(log n) - Logarithmic Time
Logarithmic time, or Big O(log n) algorithms are more complex, but typically involve dividing a problem in half recursively until a solution is reached.
This approach has a higher degree of complexity, but scales far better at larger levels than even Big O(N).
The following code doubles i every time through the loop, which should exhibit Big O(log N) performance.
#!time

long sum = 0;

for (int i = 1; i <= numItems; i *= 2)
{
    sum += i;
}
This code exhibits the following performance characteristics:
| Number of Items | Time in Milliseconds |
|---|---|
| 1 | 8.1706 |
| 10 | 9.6122 |
| 100 | 8.1899 |
| 1000 | 8.9837 |
| 10000 | 10.277 |
| 100000 | 11.4038 |

As you can see, the duration of the operations increases as the number of items grows, but it does so at a less aggressive rate than linear or quadratic time.
However, the inherent complexity of Log N operations may make them a less ideal choice than other algorithms if the item count is guaranteed to be small.
Closing Thoughts
Big O is an intimidating concept for many new learners, but looking at simple code examples and being able to explore their performance using the #!time magic command in Polyglot Notebooks helps it become much more manageable in my experience.
I wouldn’t use the #!time magic command to get mission-critical measurements or comparisons of code - I’d use a profiling tool like Visual Studio Enterprise or DotTrace for that.
However, the #!time magic command is really handy for gaining quick insights of how your code performed at the time the cell was executed.
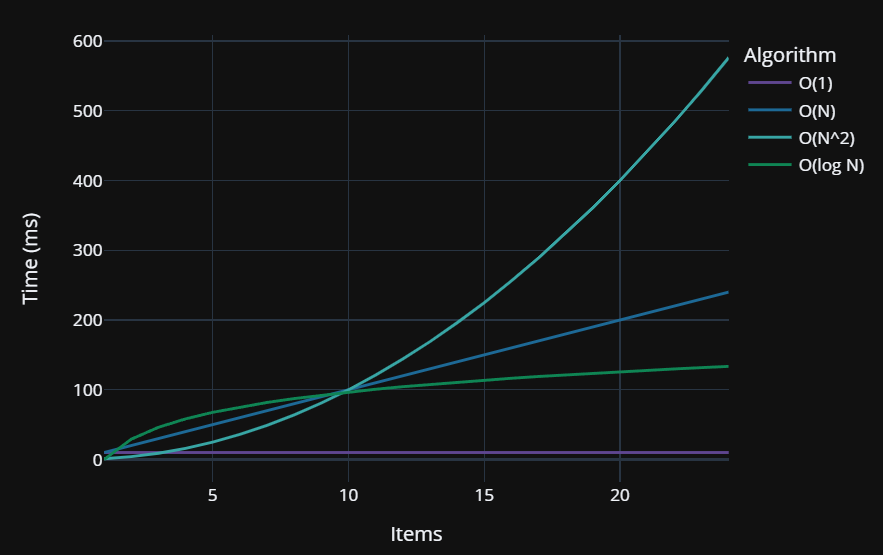
Using the measurements I was able to gather using the #!time magic command, I gathered enough data to be able to plot a fairly representative graph of Big O performance characteristics.

I don’t expect myself to use this command frequently, but when I need it, it’s nice to have it.


